100
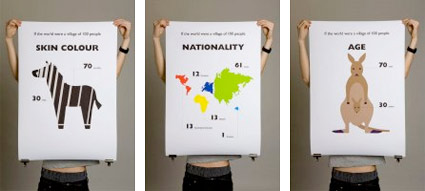
‘This is a self-initiated project based on the scenario – If the world were a village of 100 people . . . I designed a set of 20 posters, which contain most of the information.’ -Toby Ng
The images are telling. View them at Toby Ng’s website.
Statistics need visuals or they’re often perceived as just numbers. For those who don’t think visually, it’s hard to connect numbers to people.
I had a conversation about this recently regarding a group project for a research class I’m taking (hi Luci!). We were analyzing a research study and the right charting system would have really driven some very important points home.
Maybe enough to get the study accepted. Maybe get the right person to implement its findings. Maybe.
Found via Joe Rucker Design News